Social and Economic Pressure on Nature (SEPON) is fun! I'm enjoying the development of this index which will hopefully provide a guide to the pressure and utilisation of natural resources in just about any geographic area in Australia. In my introductory post I outlined some of the concepts that I would be adopting. This post is, however, mainly just an update and examples on some of the output of the SEPON model and a note on a couple of model tweaks.
First the tweaks. At very high resource pressures the model 'gave up'. There was little ability to differentiate at these high pressures. Essentially, the model could not determine whether a very high pressure was different from a moderately pressure. I've introduced a tweak in the index to slightly better resolve the higher end of the natural resource pressures essentially giving the model the ability to differentiate between 'Moderate', 'High' and 'Very High'. Interestingly, this change seems to have affected rural SEPON index values more than cities, pushing some scores up, especially due to the effect of transport pressures. For example Byron Shire Council which already had a relatively poor score of -9 actually turned out to be a -13. Walcha Shire Council had its value of 6 reduced to 2 (remember a ore positive value indicates an increased likelyhood that people are using natural resources of the area in a sustainable way and vice versa). What is a surprise is that people that live in Byron Shire Council and Sydney City now have equal scores. My gut feeling is that the effect of transport (D5) is too highly weighted in the model... I'll have to go through the assumptions again and double check. There might be another tweak needed.
 |
| Expanded Local Government area SEPON Index Values without NRU concept applied |
 |
| Where matters! |
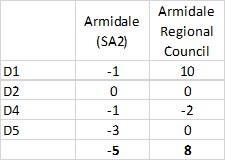
An example I'd like to show is the difference in scores in two areas Armidale Regional Council and the Armidale ABS Statistical Area (SA2). The example on the right serves to demonstrate that the Armidale ABS statistical area has an apparently overall adverse pressure on natural resources, however, the whole local government area is apparently sustainable. I.e. The manner that people use natural resources in the rest of the LGA effectively 'subsidise' the Armidale ABS Statistical Area. This seems a fairly reasonable observation especially relating to the pressure on land resources (D1). Note that this model was run before aforementioned tweak was made for high pressures.
Also, I wanted to show what happens when I start applying preliminary aspects of the Natural Resource Utilisation (NRU) concept to the Armidale Regional Council and Armidale ABS Statistical Area. Unfortunately the selection of these regions is not necessarily very good with regard to illustrating NRU, a more built up area such as Sydney might illustrate the concept better. Essentially the scores were unchanged for those two areas... I think that the adjusted SEPON index value including NRU for Byron and Sydney LGAs might be a good one to run through. I speculate that this will make Byron LGA better than Sydney. but that will be a future post.


